Solution Summary
GLJ, a leading consulting firm specializing in resource evaluation, technical studies, and emissions management, needed a more efficient way to deliver data-driven insights to their clients. With increasing demand for interactive reporting, GLJ partnered with Cadeon to implement Spotfire, a powerful data visualization and business intelligence tool.
By integrating Spotfire, GLJ was able to:
- Eliminate manual data processing, improving efficiency
- Enhance data visualization through intuitive dashboards
- Consolidate multiple data sources, ensuring accuracy and consistency
- Provide clients with real-time, interactive insights instead of static reports
Business Problem
Time-consuming workflows – Managing more than 3,000 wells per portfolio manually was inefficient
Lack of geospatial integration – Power BI was considered but could not fully handle geospatial data needs
Bespoke client data formats – Standardizing reports while keeping flexibility was a challenge
Limited collaboration tools – Sharing insights effectively across teams was difficult

Proven Solution
Cadeon worked closely with GLJ to implement Spotfire, allowing them to:
Process millions of data points in seconds, streamlining workflows
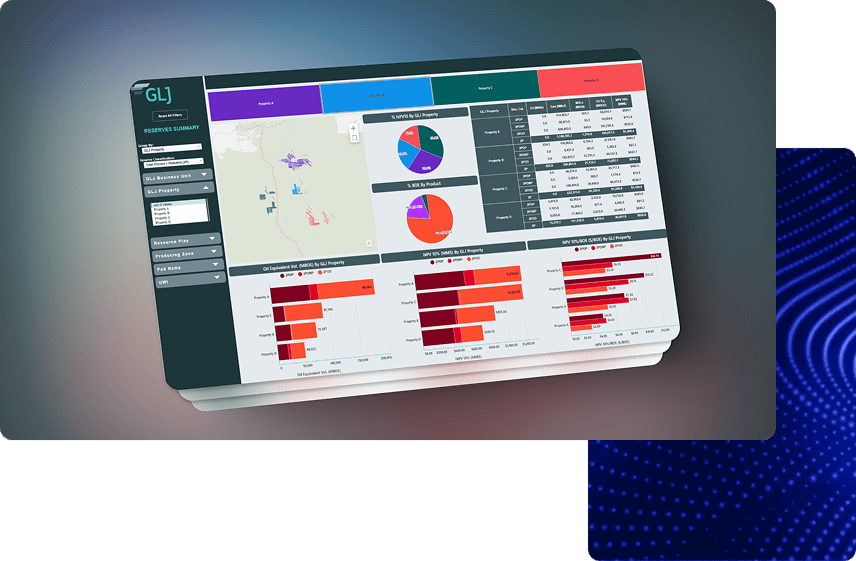
Build custom dashboards for lease operating statements, reserves, and waterflood analysis
Integrate multiple data sources, improving accuracy and efficiency
Automate manual tasks, reducing workload and increasing productivity
Empower clients with real-time, interactive insights, replacing static reports
Get the Full Case Study
Want to see the complete details of how GLJ transformed its data analysis with Spotfire? Download the full case study to explore the in-depth process, key insights, and measurable results.
What’s Inside?
- A detailed breakdown of GLJ’s data challenges and how they overcame them
- Exclusive insights into the Spotfire-powered dashboards
- Key takeaways and real-world results from the implementation
Fill out the form to access the full case study.